


Exploring LBW dismissals, bowled dismissals, leg byes, and the connection between them.
For all the following investigations, the dataset has been filtered as follows:
Male test cricket only.
Matches since 01/01/2010.
Batters who have been dismissed more than twenty times.
Who gets out LBW the most in test cricket?
The average LBW percentage sits at 17%. There appears to be no clear connection between a batter’s skill, and a batter’s LBW percentage. Opening batters do seem to get out LBW more, given they are more likely to face deliveries with a high degree of swing.
The batters who are out LBW the most are:
Ahmed Shehzad (+21% LBW dismissals over the mean, 41 test batting average)
Donald Tiripano (+21%, 22)
Taufeeq Umar (+19%, 38)
JP Duminy (+19%, 33)
Ed Cowan (+18%, 31)
Surprisingly, this list contains mostly recognised batters, rather than tailenders. Similarly, three of them were predominantly opening batters.
The batters who are out LBW the least are:
Mohammed Shami (-15%, 12)
Virender Sehwag (-15%, 49)
Umesh Yadav (-15%, 11)
Sam Curran (-14%, 25)
Rubel Hossain (-13%, 9)
In contrast, this list contains mostly tailenders. This data shows no clear connection between batter skill and their vulnerability to LBWs. Instead, LBW vulnerability seems to be influenced by stylistic choices and exposure to the new ball.
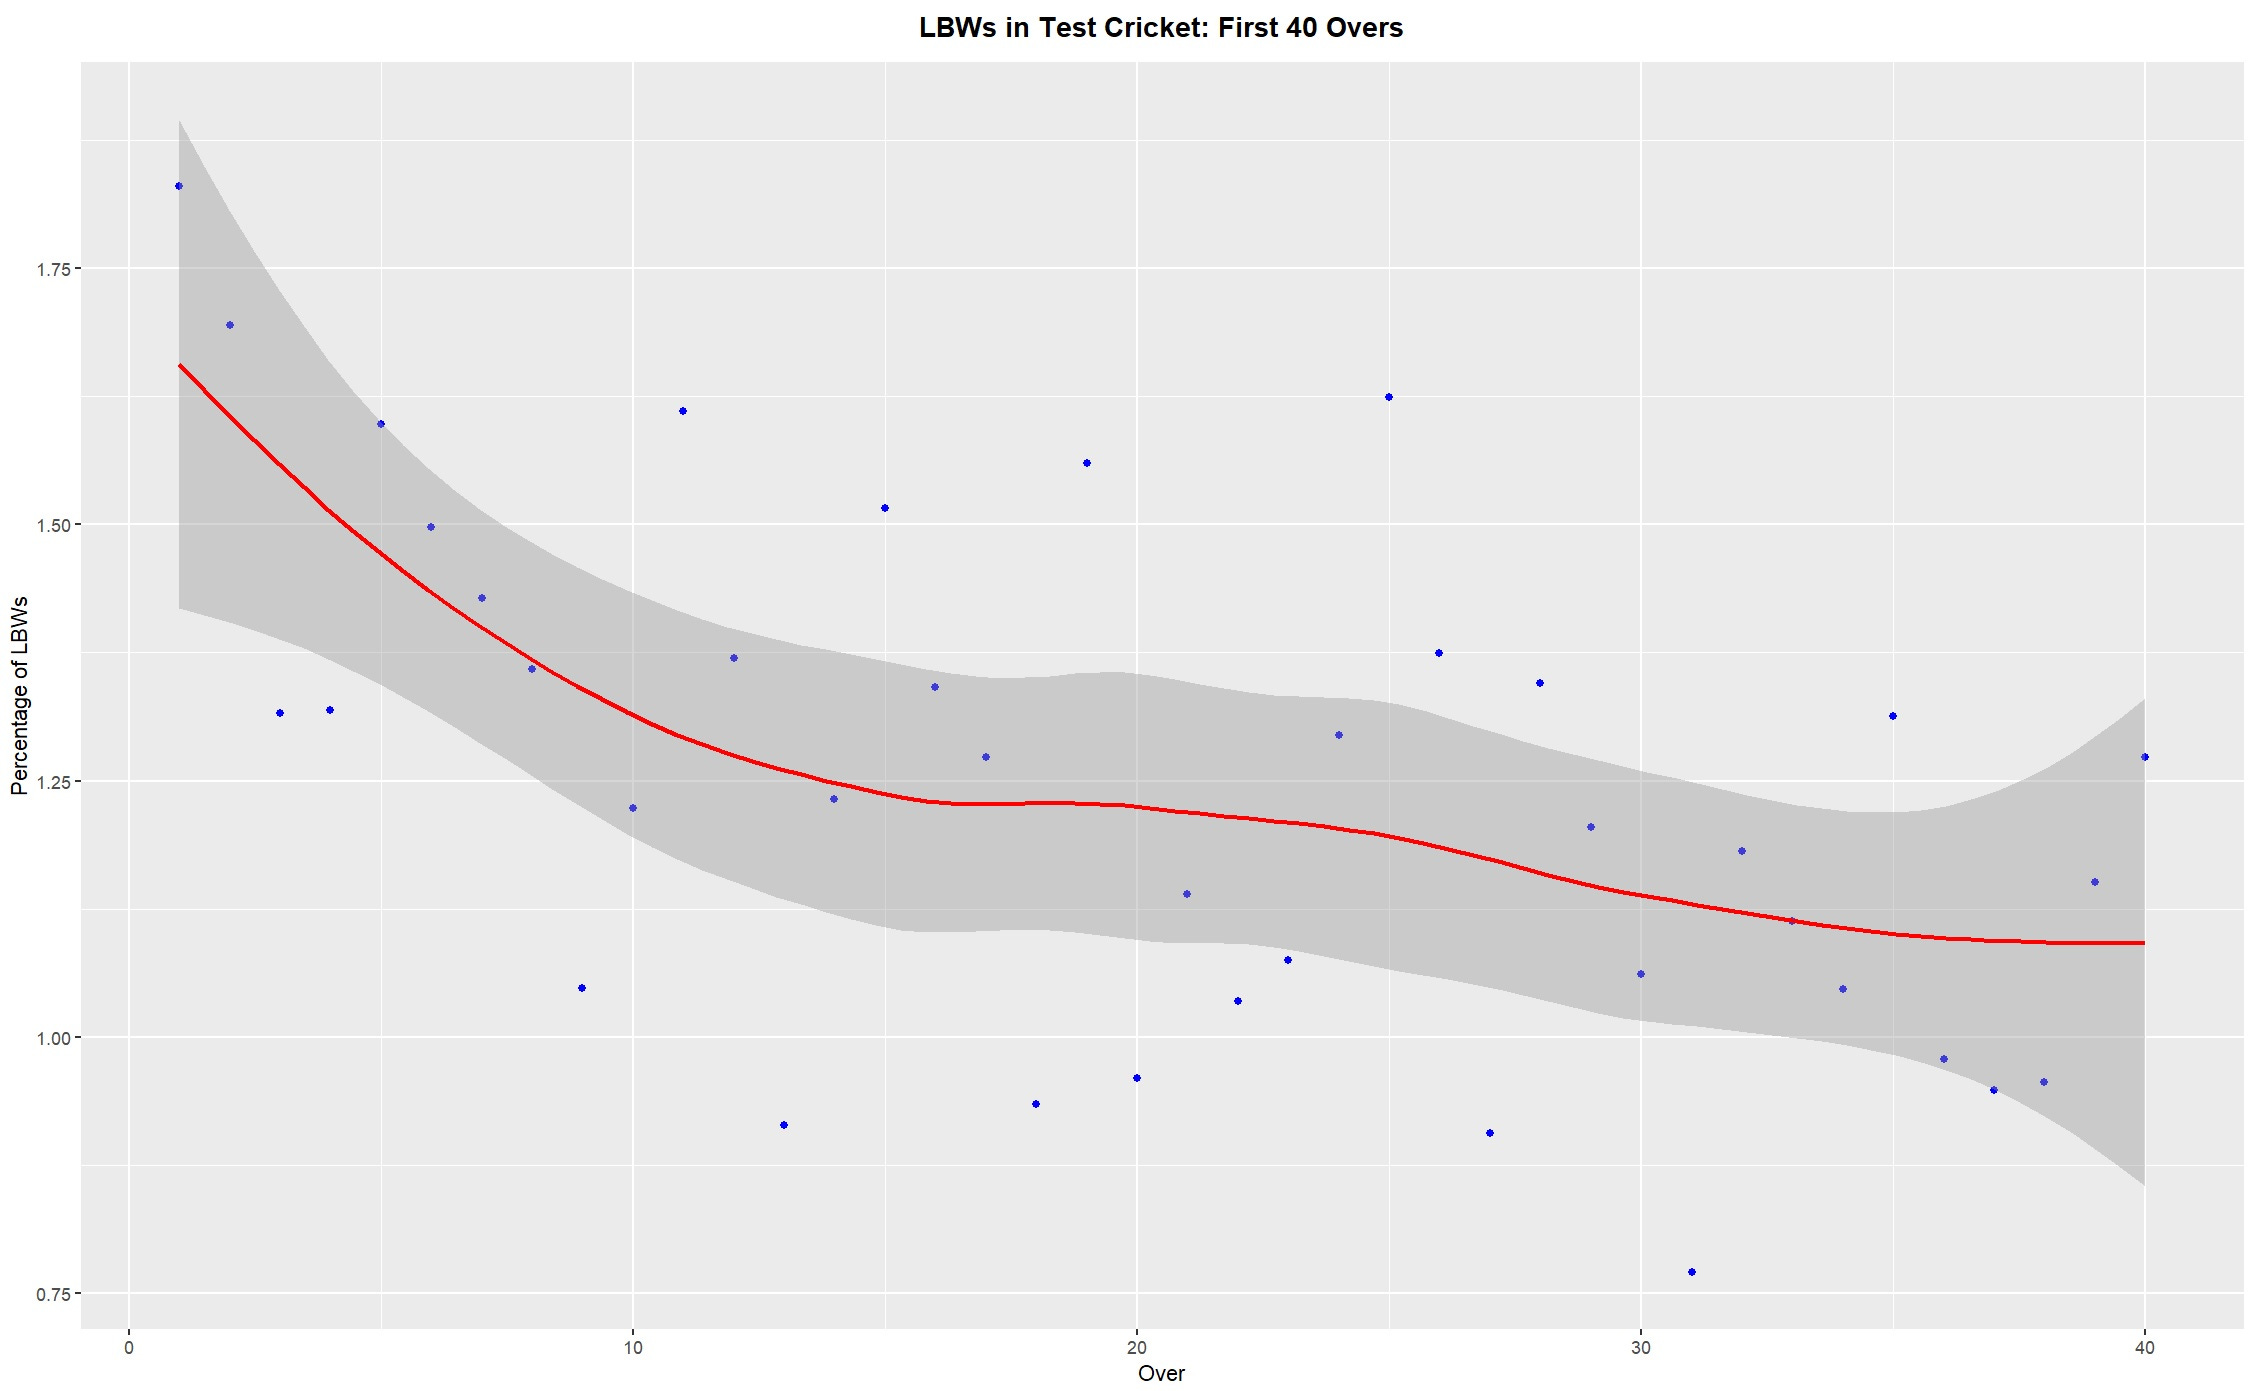
As seen below, the earliest overs of a test match have high rates of LBW dismissals. LBWs decrease as the ball gets older, presumably because the ball is moving less, both in the air and off the seam. Following 40 overs, the rate of LBWs actually increases again. This is likely due to spin bowling, pitch deterioration and/or lower quality batters arriving at the crease.
Are recognised batters better at protecting their stumps?
The above analysis showed that top-order batters may actually be more vulnerable to LBW dismissals. However, we need to investigate the connection between LBW and bowled dismissals. It is essentially the same dismissal, with the batter getting out to a ball that was threatening the stumps. All that changes is whether their leg was in line with the ball.
The average proportion of stump-based dismissals was 34%. Again, this method produced mixed results. There is a clear interplay between stump-based dismissals and bowling tactics. For example, tailenders who are susceptible to short-pitched bowling will rarely get out LBW or bowled, but this doesn’t really demonstrate their skill at dealing with those deliveries. Of course, this question would be much easier with some proprietary data from CricViz, which could produce dismissal percentages for balls that would hit the stumps.
The worst batters at protecting their stumps are:
Nkrumah Bonner (+25%, 38)
Ahmed Shehzad (+24%, 41)
Shannon Gabriel (+22%, 4)
Tom Blundell (+21%, 44)
Cameron Green (+19%, 34)
The best batters are protecting their stumps are:
Bhuvneshwar Kumar (-22%, 22)
Jasprit Bumrah (-20%, 7)
Dhammika Prasad (-19%, 13)
Sam Curran (-19%, 25)
Rishabh Pant (-19%, 44)
We can see that most of these names have changed. There does appear to be a trade-off between LBW and bowled dismissals. For example, Shane Watson was renowned as an LBW candidate throughout his career. In our dataset he was out LBW 22% of the time, which is 6% higher than the mean. However, he was only out bowled in 12% of his innings. When taken together, this means he was perfectly average at defending his stumps, falling to stump-based dismissals 34% of the time. As an opening batter, this may even be slightly above average.
Are leg byes associated with LBWs?
The mean leg bye rate in test cricket is 2.1, meaning that we would expect a batter to create 2.1 leg byes per 100 runs scored. As previously established, the mean LBW dismissal percentage is 17%. Each point on the below graph represents a test cricketer’s batting career.
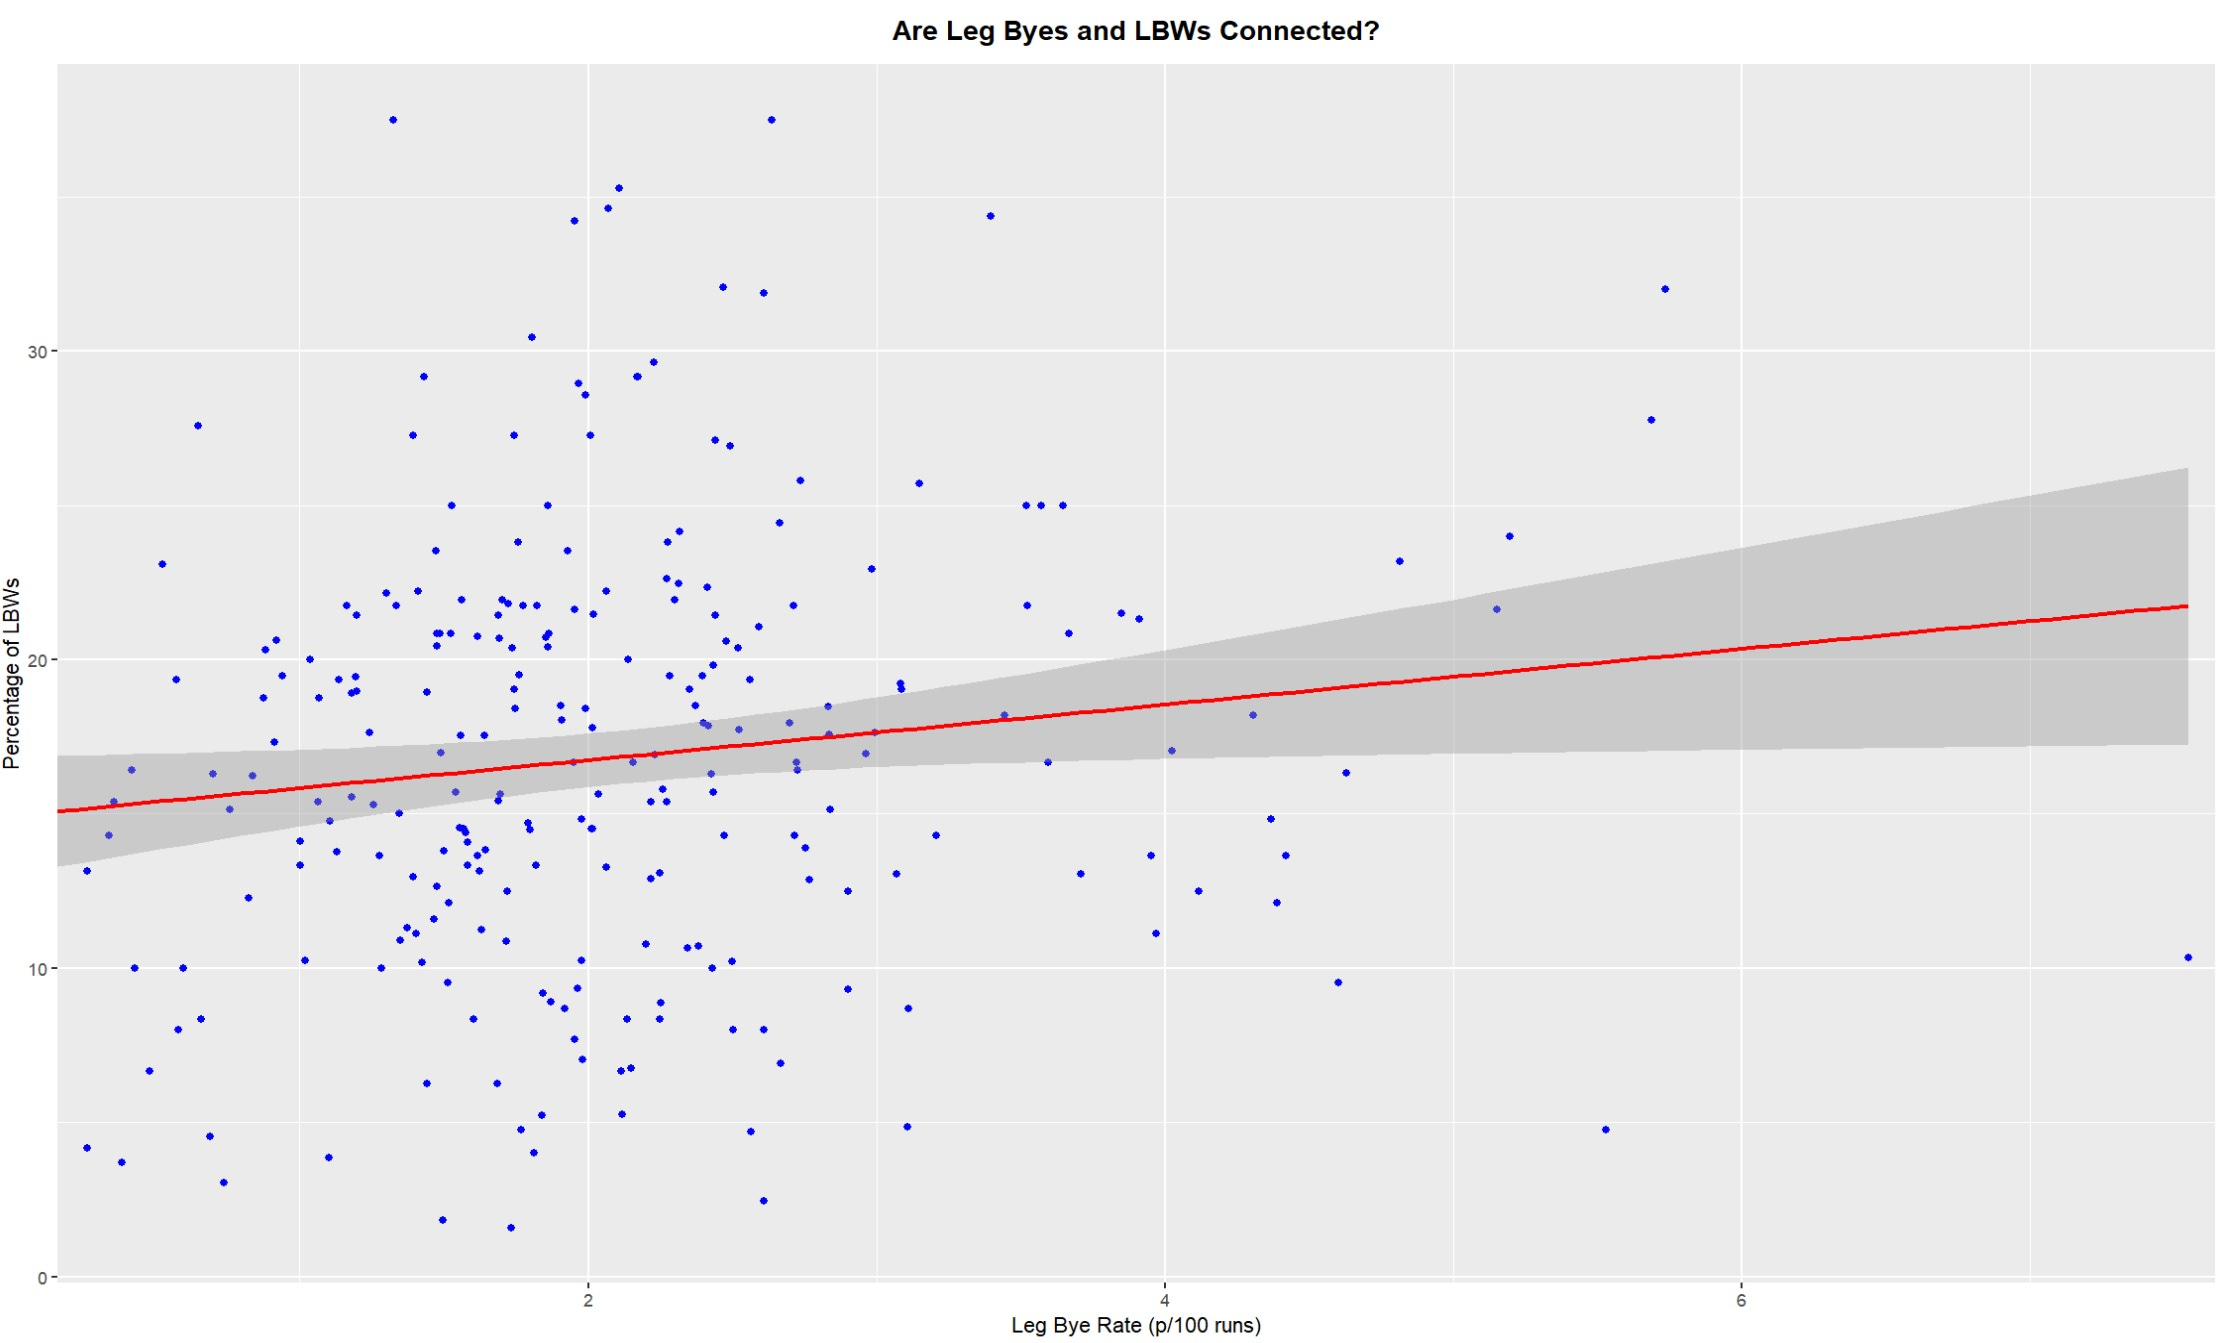
The answer to our question is… not really, this is a fairly random association. However, it does have some interesting outliers. For example, Jasprit Bumrah’s leg bye rate is a massive 7.55, far greater than anyone else in the sample. But he is only out LBW 10% of the time, perhaps hinting that he is often targeted with short bowling. Once again, bowling tactics are confounding our investigations.
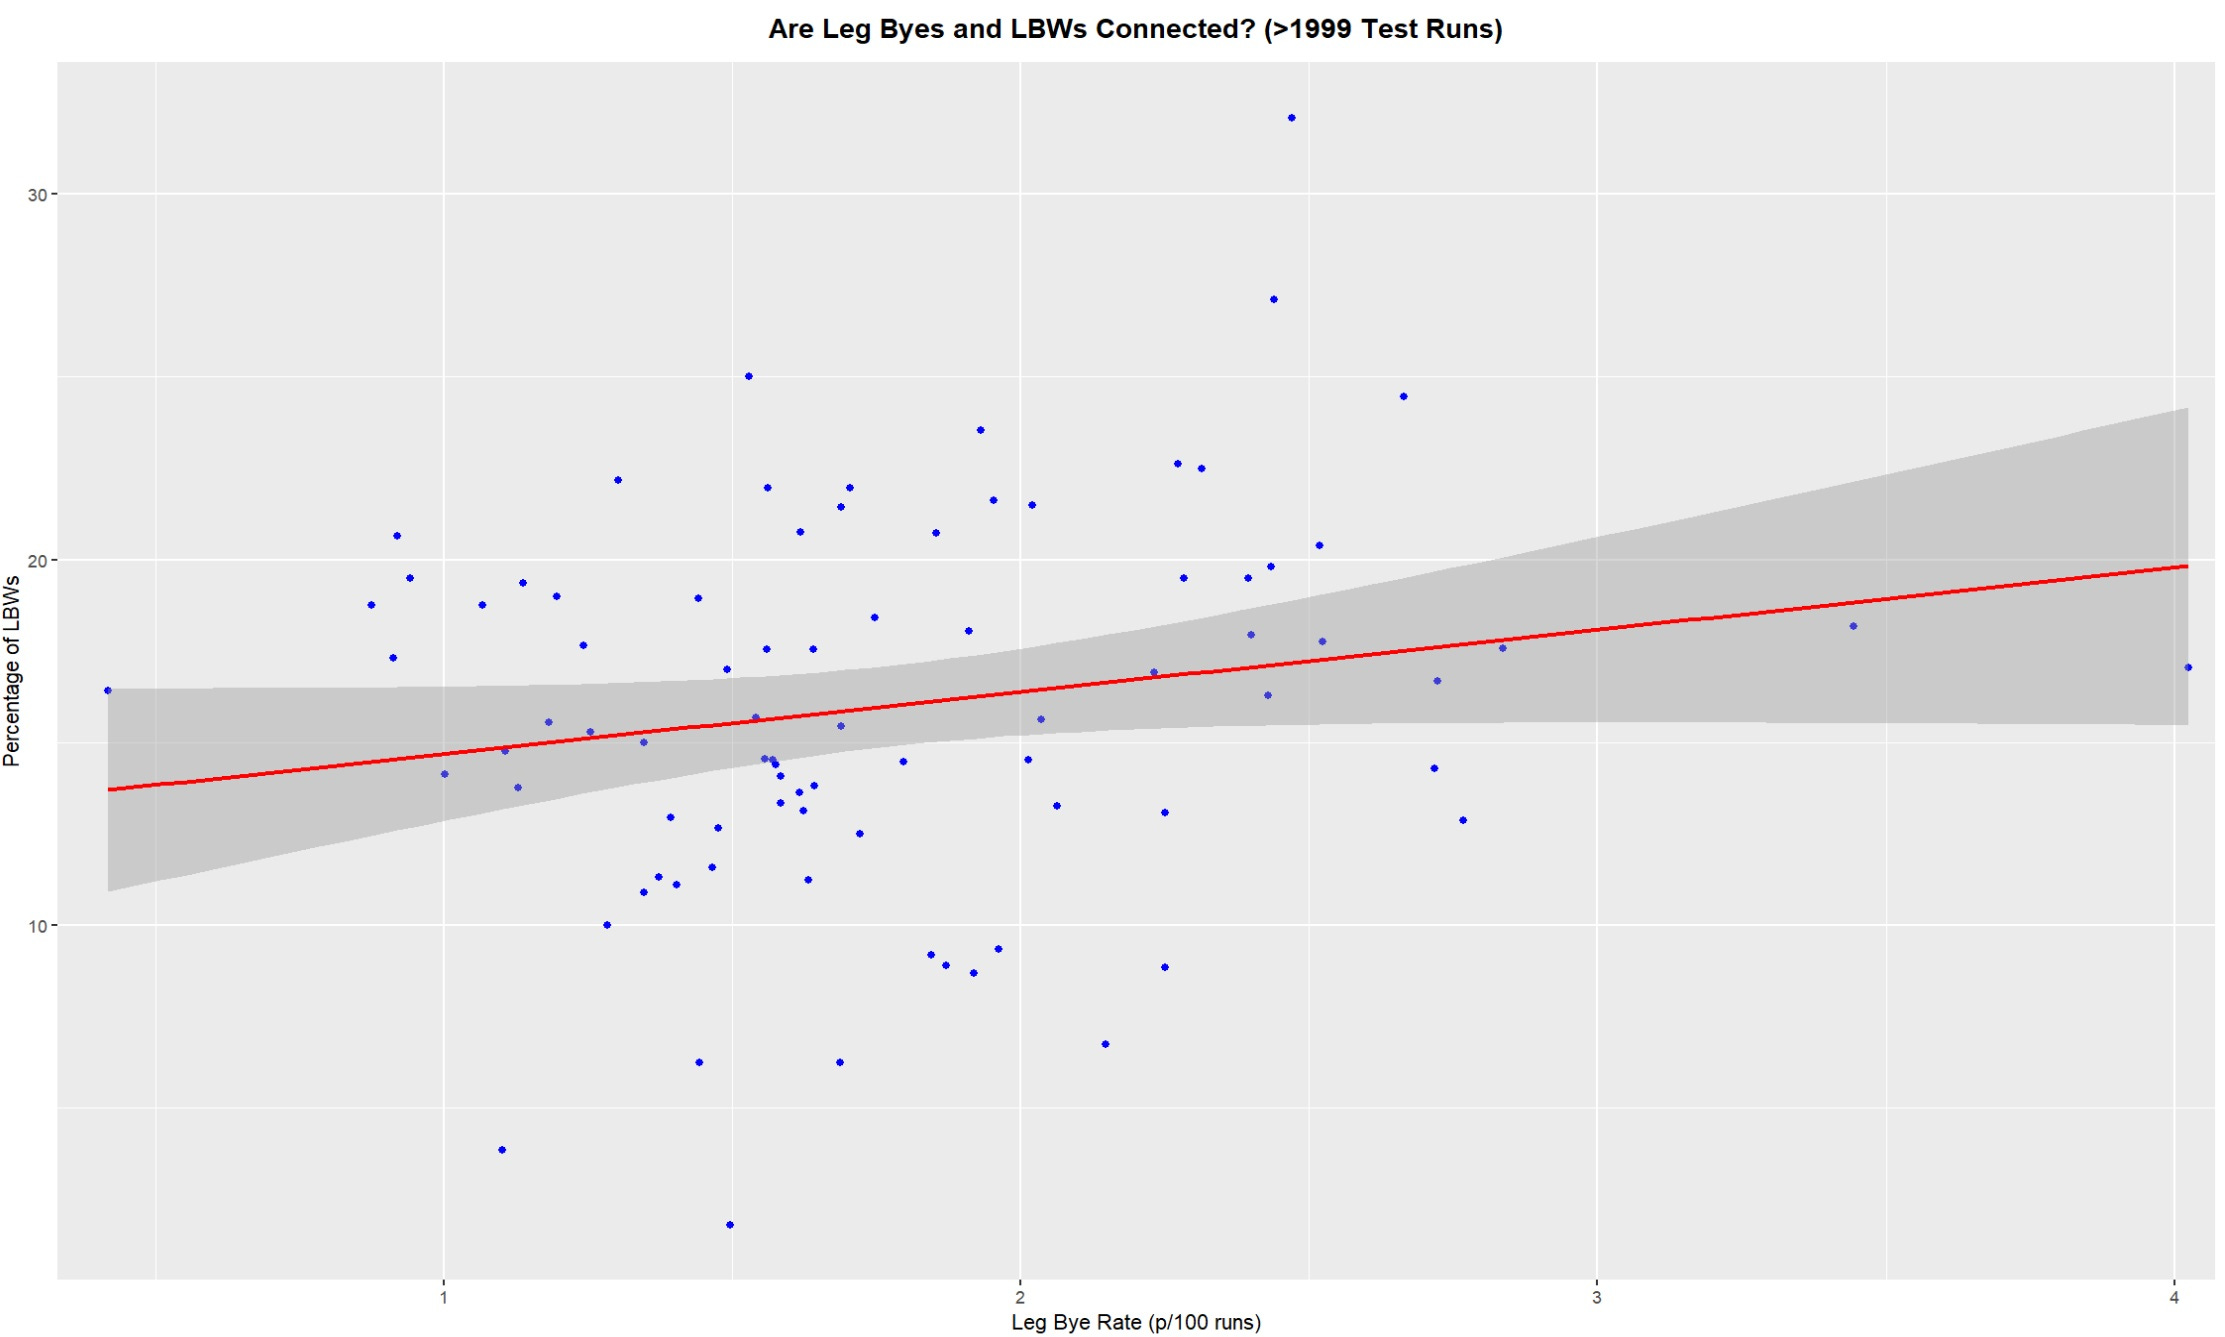
Even adjusted for test batters with 2000 runs, there is no association between leg byes and LBWs. We do see that a leg bye rate over 3 is very uncommon for established test batters. In this dataset, only Stuart Broad (4.02) and Shaun Marsh (3.44) pass that mark. The mean leg bye rate for this dataset is now only 1.78, compared with 2.1 earlier. This demonstrates that established test batters create less leg byes than tailenders. Similarly, this subset of batters had an average LBW percentage of 16%, which is 1% less than the entire dataset.
Liton Das, Babar Azam, Faf du Plessis, Aiden Markram and Mohammad Hafeez are all around average for LBW%, but they create less than 1 leg bye per 100 runs. In contrast, Stuart Broad, Shaun Marsh, Martin Guptill and Jonny Bairstow have comparable LBW percentages, but all create more than 2.5 leg byes per 100 runs.
I initially thought that batters with high LBW percentages would also have high leg bye rates, simply due to the volume of balls that hit them on their pads. But this isn’t the case, with leg bye rate showing no correlation with LBW percentage. An obvious confounding variable is the fact that a “leg bye” doesn’t just apply to balls hitting the pad, but rather balls hitting anywhere on the body. For example, Stuart Broad has a very high leg bye rate, not from being hit on the pad, but rather from being struck by short balls.
I don’t think the necessary data exists, but it would be very interesting to quantify “stance” and analyse it against LBW percentage. Are batters who stand on middle stump more susceptible to LBW than those who stand on leg? What about batters who deliberately place their front foot outside the line of off stump? Steven Smith is notorious for walking across his stumps, but this also helps him get outside the line of the stumps. He has a normal LBW percentage (17%) and a slightly below average leg bye rate (1.5).